Where Are Americans Moving?
In the age of COVID-19, where are Americans moving?
First, why does it matter? Why should you, as a real estate investor, even care?
You should pay attention to overall migration patterns because it’s one of the best predictors of future economic growth in an area, particularly for real estate.
In their best-selling book Good Economics for Hard Times, Nobel-prize-winning economists Abhijit Banerjee and Esther Duflo explain, through a myriad of studies, the effect of migration on jobs. Many tend to assume that more workers in an area is a bad thing for the local economy. With a growing population, natives in the area are going to have an even harder time finding work, right? A higher supply of workers leads to lower wages (or possibly no jobs at all).
But that ignores the fact that migrants aren’t just workers. They don’t exist merely to subsist on low-wage work. They’re also consumers. They still want entertainment. As Banerjee and Duflo write, “They go to restaurants, they get haircuts, they go shopping. This creates jobs.” Furthermore, they need housing — which spurs a whole flurry of activity in the real estate market, from property listing to rental management.
As a result, migration patterns largely drive higher real estate prices for both residential and commercial spaces.
And, when you think about it, this makes logical sense. As long as the area has decent infrastructure and basic amenities necessary for living, some of the best cities in the world have also had the most significant population growth year-over-year — usually for decades.
In this article, we’ll give you the 10 states with the highest inbound movers in America, so you can decide for yourself where the best areas in the United States are for real estate investment.
10 Areas With Highest Inflow in the United States in 2020
In this section, we’ll use the annual study from United Van Lines to look at both inflows and outflows together. It isn’t enough to look at how many people are moving into an area, because that only gives you half the picture. You also have to look at how many people are moving out of that area. If, for example, you saw headlines saying 50,000 people moved to California this month, that could paint a much prettier picture than if, in that same time period, 300,000 people moved out. The state would have lost 250,000 residents in total.
A Note on the Limitations of the Data
The United Van Lines study is the largest household goods mover in the United States. However, it only looks at roughly 110,000 families: those who used United Van Lines for their moving needs. In any given year, close to 40 million Americans move from state to state. So, if you assume an average family size of 3.14, we’re only looking at roughly 350,000 total US residents, or about 10% of total state-to-state migration — and that isn’t a strictly representative sample.
Combined with US Census data on overall population counts state-by-state, we’ll be able to form a more complete analysis. In the absence of that data for the year 2020, though (because of pandemic delays), this is the best we’ve got. When we receive that data, we’ll be back to update this article.
It still gives a generally accurate overall idea of where people are moving. We can’t say with 100% certainty that you can multiply the numbers below by 10 to get an accurate idea of exactly how many families have moved to that area, but we’ll wager that it’s a decent indicator. The real figure is probably somewhere in the ballpark, but it would also include people who are traveling alone, who don’t need moving services. That’s likely a significant chunk of overall migrants.
The gist, then, is that the overall trend line matters most, and our estimates are just estimates based on data averages.
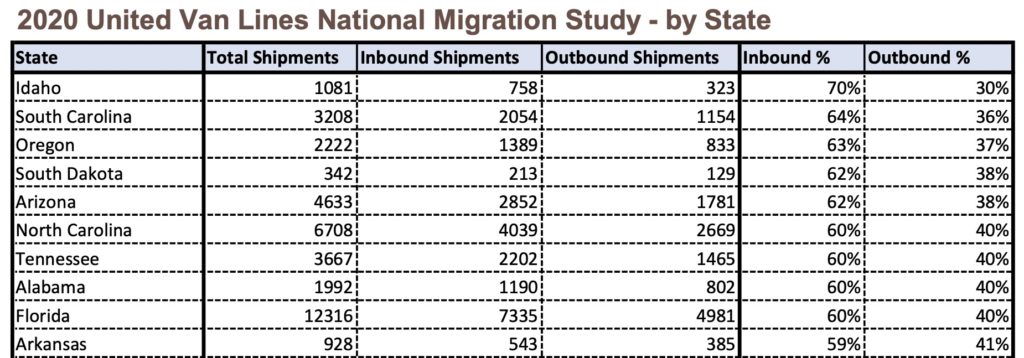
1. Idaho – 70% inflow, 30% outflow
Idaho has the highest inflow compared to every other state in the nation. They had 758 inbound shipments and 323 outbound shipments, for a total gain of 435 families to the state through this moving service alone. That might not sound like a lot, but the general trend is what matters most.
If our logic above holds, that means that Idaho could’ve gained as many as 14,000 new residents this year.
2. South Carolina – 64% inflow, 36% outflow
South Carolina is second on the list, with 2,054 inbound shipments and 1,154 outbound shipments, for a gain of approximately 900 families. That suggests South Carolina could see as many as 28,000 new residents this year.
3. Oregon – 63% inflow, 37% outflow
Oregon is up next with 1389 inbound shipments and 833 outbound shipments. Oregon could have as many as 18,000 new residents.
4. South Dakota – 62% inflow, 38% outflow
South Dakota doesn’t have very many inbound or outbound families, but they still saw a gain of 84 total shipments, which could mean a new 2,500 residents.
5. Arizona – 62% inflow, 38% outflow
The data on Arizona is a bit more robust than the data on South Dakota. They’ve had 4633 total shipments, 2852 inbound and 1781 outbound. That means there’s a gain of about 1071, or roughly 33,000 new residents.
6. North Carolina – 60% inflow, 40% outflow
North Carolina has even more total shipments than Arizona, with 6708. There are 4039 inbound and 2669 outbound, for a total gain of 1370. That could possibly lead to as many as 43,000 new residents.
7. Tennessee – 60% inflow, 40% outflow
Tennessee has 3667 total shipments, with 2202 inbound and 1465 outbound. That’s an additional 737 new families through United Van Lines alone, or a possible 23,000 new residents, using our rough estimate.
8. Alabama – 60% inflow, 40% outflow
Alabama 1992 total shipments: 1190 inbound and 802 outbound. That means they’ve added an additional 388 new families or 12,000 possible new residents.
9. Florida – 60% inflow, 40% outflow
Out of all the states listed so far, Florida has the highest total shipments at 12316: 7335 inbound and 4981 outbound. That’s a gain of 2354. We estimate that could mean there’s a positive inflow of roughly 75,000 residents to Florida.
10. Arkansas – 59% inflow, 41% outflow
With a gain of 158 new families, Arkansas likely saw anywhere from 2-3k more residents this year.
Why Are Americans Moving?
Many businesses and families are moving as a result of the pandemic — not necessarily financial hardship (although that is a prime reason) but also to lower their cost of living. The 2020-2021 study from Neighbor shows that 47% of total respondents are moving to lower their cost of living.
When a lot of bars, restaurants, and offices get shut down in San Francisco, for instance, and your company has now fully embraced working from home, there’s no reason to pay extra to live in a tiny apartment if you’re just as happy living in South Carolina.
That’s why we focus much of our business on the American southeast: it still offers a relatively low cost of living, great weather, and people are flocking to it en masse, as you can see with the influx of new residents into Florida, North and South Carolina.
Conclusion: Where Are Americans Moving?
Americans are, by and large, leaving high cost of living cities for lower cost of living areas.
Migration is often a great thing for local economies, and when a lot of young, bright remote workers are pouring into North Carolina, earning an income that was meant for a high cost of living in Southern California and spending all of that money on businesses in the Carolinas, we’re going to see those economies take off in the near future.
LEARN MORE ABOUT PASSIVE INVESTING
Join our newsletter to stay up to date with the latest content and upcoming deals.